Productivity Monitoring Software and the New Metrics of Remote Engineering
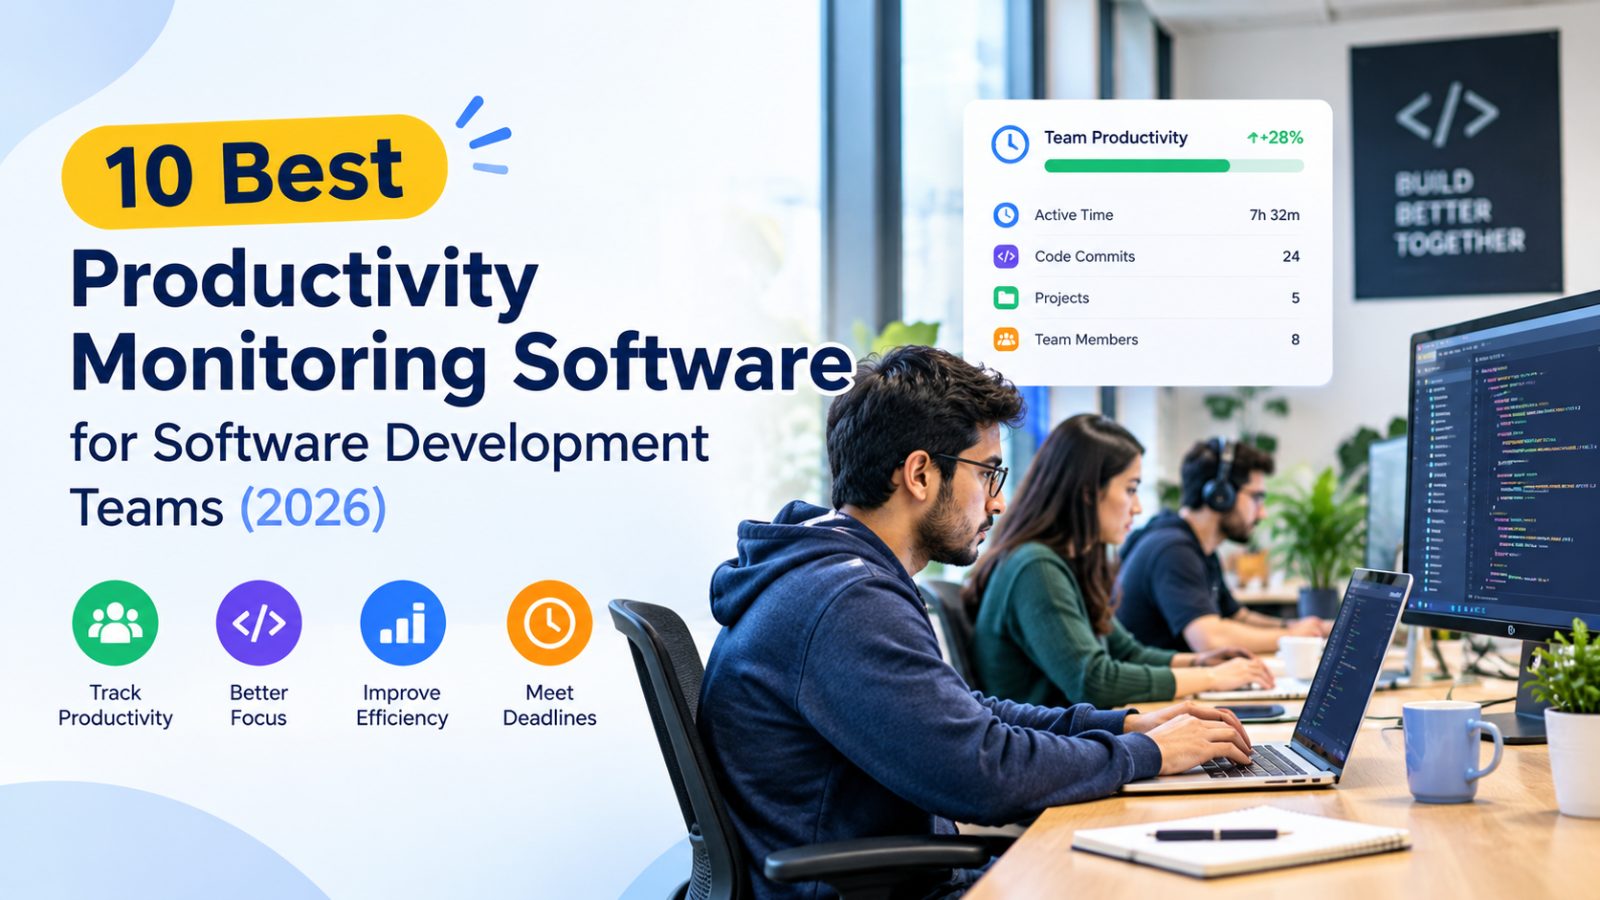
On October 23, 2026, TechBullion published its roundup of ten productivity monitoring platforms aimed at software development teams. The list itself is unremarkable in format: time tracking, screenshot capture, application usage analytics, and increasingly, AI-assisted summarization of work patterns. What makes it worth a close read from an African vantage point is the timing. The past 48 hours have seen a cluster of procurement conversations across Nairobi, Lagos, and Cape Town engineering organizations in which the buyer's first question is no longer "what does it track?" but "what does it cost us in trust?"
The category has matured past the era of keystroke counters. The 2026 generation of tools leans on calendar integration, repository metadata, and ticket lifecycle events rather than screen scraping. That shift matters disproportionately for distributed teams, where the physical office no longer supplies incidental context and every signal must be constructed deliberately. For African engineering leaders managing hybrid teams across time zones, the design choices inside these platforms now intersect directly with compensation benchmarking, retention, and the credibility of remote work as a career path.
The Signal Hierarchy Inside Modern Monitoring Platforms
The ten tools in the TechBullion survey differ in packaging but converge on a common data model. At the bottom sit passive activity signals: active window time, idle detection, application categorization. One tier up are collaboration signals: meeting load, response latency in messaging tools, document edit frequency. The top tier, and the one vendors now market hardest, is delivery signal: pull request cycle time, review turnaround, deployment frequency, and incident participation.
The hierarchy is not neutral. Passive activity data is cheap to collect and nearly useless for predicting whether a sprint will land. Delivery data is expensive to instrument correctly and highly predictive. Vendors that lead with screenshots are selling the cheap tier; vendors that lead with repository and incident analytics are selling the expensive one. The pricing gap between those two positions has widened through 2026, and the procurement friction has moved accordingly.
| Signal tier | Collection cost | Predictive value for delivery | Typical buyer objection |
|---|---|---|---|
| Passive activity (idle, window focus) | Low | Low | Perceived surveillance |
| Collaboration (meetings, response time) | Medium | Medium | Penalizes deep work |
| Delivery (PR cycle, deploy frequency) | High | High | Requires clean repo hygiene |
| Outcome (incident rate, rework) | High | High | Attribution ambiguity |
For teams running on GitHub or GitLab with disciplined branch protection, the delivery tier is largely free: the metadata already exists. The hard part is interpretation. A pull request that sits for three days because a senior reviewer is on leave looks identical in the dashboard to one that sits because the author is disengaged. Platforms that surface raw cycle time without review-load context generate false signals, and false signals in a compensation review are expensive.
Why African Engineering Organizations Are Reading the Fine Print
The remote work reality across the continent has shifted in ways that make monitoring procurement a strategic decision rather than an administrative one. Nairobi's fintech corridor now runs engineering teams that span Nairobi, Kigali, and occasionally Lisbon. Lagos product companies routinely employ contractors across West Africa with overlapping but non-identical working hours. Cape Town firms serving European clients operate in a permanent half-time-zone offset. In each configuration, the manager's visibility problem is real, and the temptation to solve it with software is strong.
The countervailing pressure is compensation. Developer salaries in these markets have been benchmarked against global remote rates for several years, and the top of the local market now competes with mid-level European offers. Engineers who can earn international rates have leverage, and they exercise it when they perceive monitoring as a substitute for management competence. Several hiring conversations I have tracked this week in Lagos and Nairobi included explicit questions about whether the employer uses activity monitoring and how the data feeds into performance reviews. Candidates are asking before accepting offers, not after.
That changes the calculus for buyers. A monitoring platform that produces clean delivery metrics and is transparently scoped to team-level trends is a retention asset. A platform that produces individual activity scores and feeds them into stack ranking is a recruiting liability in a market where the best engineers have options. The same software can be either, depending on configuration and policy.
The Vendor Landscape and Its Configuration Traps
The TechBullion list spans the familiar archetypes: full-suite workforce analytics, developer-specific engineering intelligence, and lightweight time trackers with AI summarization bolted on. The distinctions that matter operationally are less about feature checklists than about default settings. Most platforms ship with individual-level dashboards enabled and team-level aggregation available but not default. That default is the single most consequential configuration choice an engineering leader makes, because it determines what managers see first and therefore what they manage toward.
A second trap is data retention. Several platforms retain granular activity data for extended periods by default, which creates discovery exposure in employment disputes and, in jurisdictions with data protection regimes, potential compliance friction. Kenya's Data Protection Act and Nigeria's Data Protection Act both impose purpose limitation and minimization obligations that apply to employee monitoring data. Organizations that deploy without a documented purpose and retention schedule are exposed, and the exposure is not hypothetical: regulatory attention to workplace analytics has increased across the continent through 2026.
A third trap is integration fidelity. Delivery metrics are only as good as the repository and ticketing hygiene beneath them. Teams that squash-merge inconsistently, that use ticket statuses loosely, or that maintain parallel tracking in spreadsheets will produce dashboards that mislead. The platform cannot fix process debt; it can only amplify it. Buyers who evaluate tools on demo data rather than their own repository history routinely discover this after signing.
Benchmarks That Matter More Than Feature Counts
When engineering leaders ask me how to compare these platforms, I steer them away from feature matrices and toward four operational benchmarks. The first is time-to-first-insight on their own data: how long from connection to a dashboard that reflects their actual delivery patterns. The second is false-positive rate on review bottlenecks: does the tool correctly attribute stalled work to reviewer load rather than author inactivity. The third is export and portability: can the organization extract its own metrics if it changes vendors, or is the history locked in. The fourth is policy transparency: does the vendor document exactly what is collected, where it is stored, and who can see individual-level data.
These benchmarks are unglamorous and rarely appear in vendor marketing, but they predict whether a deployment survives its second year. The pattern I have observed across African deployments is consistent: the tools that stick are the ones whose output managers actually use in planning conversations, and the ones that get quietly abandoned are the ones whose dashboards nobody opens after the novelty fades. Adoption is a function of relevance, not comprehensiveness.
The Compensation and Retention Feedback Loop
There is a second-order effect that deserves more attention than it gets. Monitoring data, once collected, tends to migrate into performance reviews, and performance reviews feed compensation decisions. In markets where developer pay is already under global pressure, the introduction of activity-based metrics into review cycles can compress pay for engineers whose work is high-value but low-activity: the architect who spends three days reading and thinking before writing a design document, the on-call engineer whose visible output is quiet vigilance. These roles are precisely the ones that distributed teams struggle to evaluate without instrumentation, and precisely the ones that activity metrics misjudge.
Organizations that get this right separate the two data streams. Delivery metrics inform planning and process improvement. Compensation decisions rest on outcome evidence: shipped features, incident reduction, review quality, mentorship. The separation is a policy choice, not a product feature, and it is the choice that determines whether monitoring software strengthens or erodes the employment relationship. In a competitive market, that relationship is the asset that retains senior engineers, and no dashboard compensates for losing them.
What to Watch as the Category Consolidates
The productivity monitoring category is consolidating. Several of the ten platforms in the TechBullion roundup have absorbed smaller competitors over the past year, and the survivors are converging on similar feature sets with different positioning. The differentiator that will matter through 2027 is not collection capability but interpretation: the quality of the models that convert raw signals into actionable team-level insight without generating individual surveillance artifacts. Vendors that solve interpretation will sell to engineering leaders; vendors that sell collection will sell to procurement and then get ripped out.
For African engineering organizations, the practical guidance is straightforward. Instrument delivery metrics first, because the data already exists and the signal is strongest. Scope dashboards to teams by default and require explicit justification for individual views. Document purpose and retention before deployment, not after. And keep compensation decisions anchored to outcomes, with monitoring data as context rather than verdict. The tools are capable enough to be useful; whether they are useful depends on the policy wrapped around them. The TechBullion list is a starting point for vendor evaluation, but the harder work is the governance that no vendor sells.